
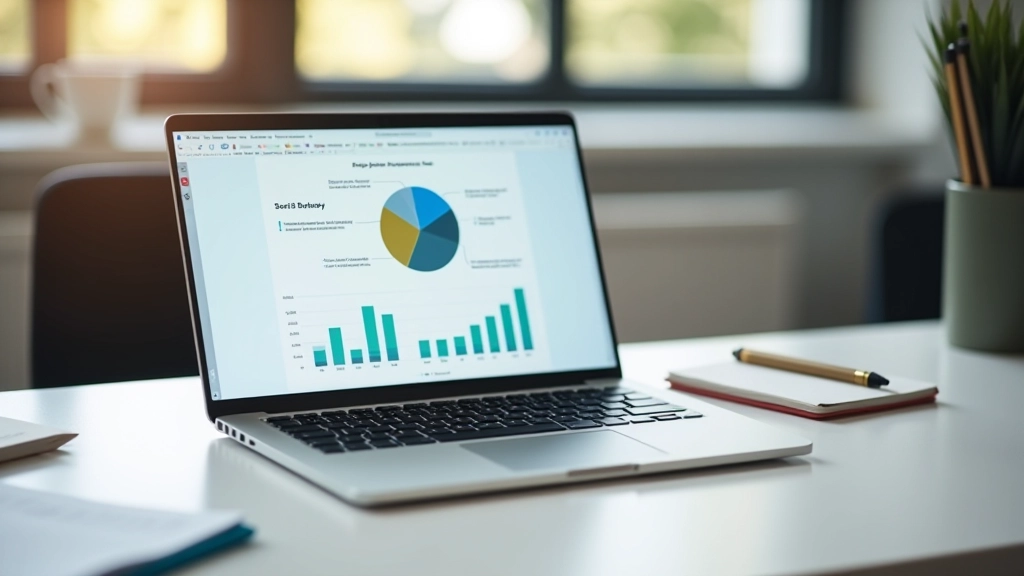
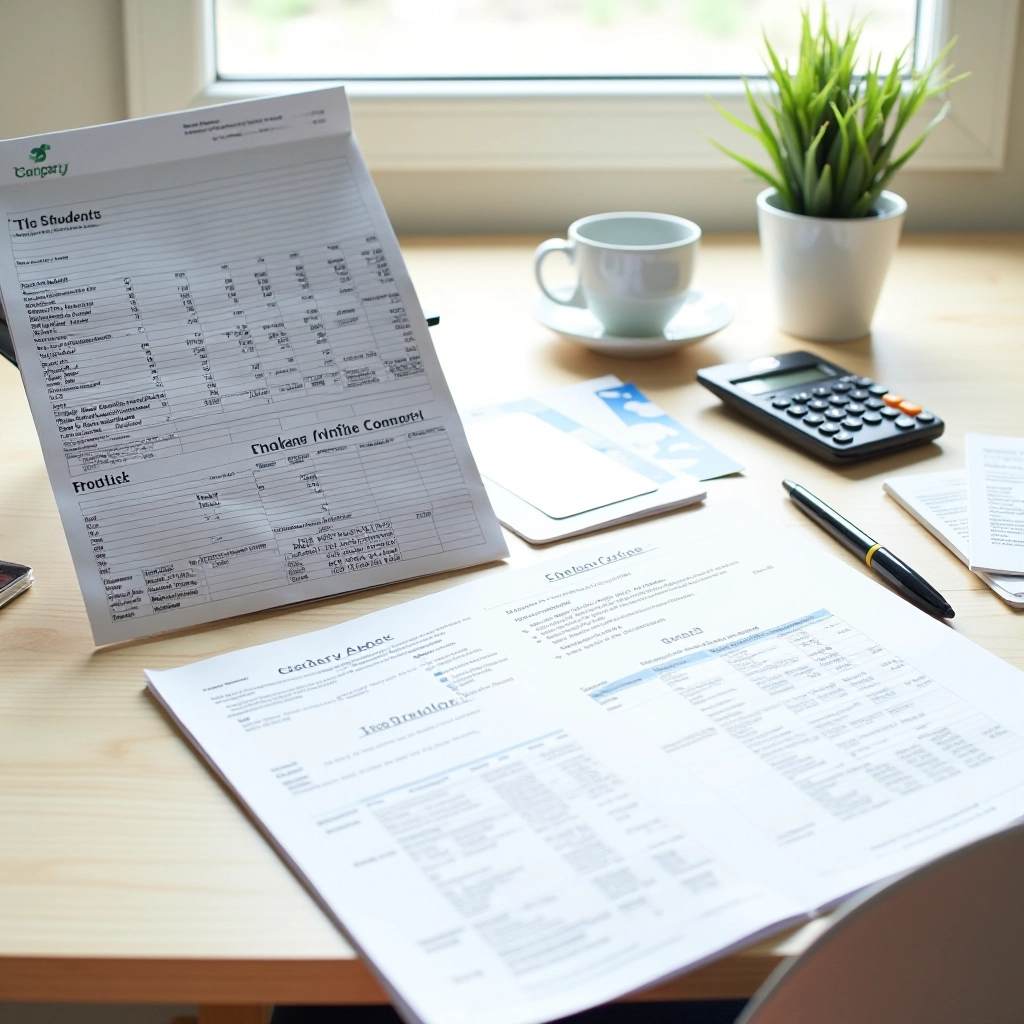
Why Spending Patterns Matter
You've probably tracked your spending before. Downloaded an app, made a spreadsheet, wrote down every transaction for a month. But then what? The data sits there, a bunch of numbers that don't really tell you anything useful. That's where most people get stuck.
Understanding your spending patterns is different. It's not about having perfect numbers — it's about seeing what those numbers actually mean. When you analyze patterns, you're looking for the real story: where your money flows, what triggers your purchases, and where the gaps are between what you intended to spend and what you actually spent.

The difference matters because patterns reveal behavior. Maybe you don't actually overspend on groceries — you're just buying coffee before class five days a week. Maybe your "entertainment" budget isn't really about movies; it's late-night food runs when you're stressed. Once you see these patterns, you can actually do something about them. Not by cutting everything, but by making intentional choices based on what you've learned about yourself.
The Data Collection Phase
Before you can analyze anything, you need clean data. This doesn't mean being obsessive about tracking every single dollar (though some people like that). It means having a system that captures enough detail to be useful without becoming a chore you'll abandon after two weeks.
Pick Your Tracking Method
You've got options here. A spreadsheet gives you full control — you decide what categories matter, how detailed to get, what formulas to use. Most students use Google Sheets because it's free and you can access it from anywhere. Apps like YNAB or PocketGuard automate the collection by linking to your bank account, which saves time but costs money. Some people use a hybrid: app for everyday spending, spreadsheet for monthly analysis.
Whatever you pick, the key is starting. Don't wait for the perfect system. A rough spreadsheet you actually use beats a perfect system you never touch.
Finding Patterns in Your Numbers
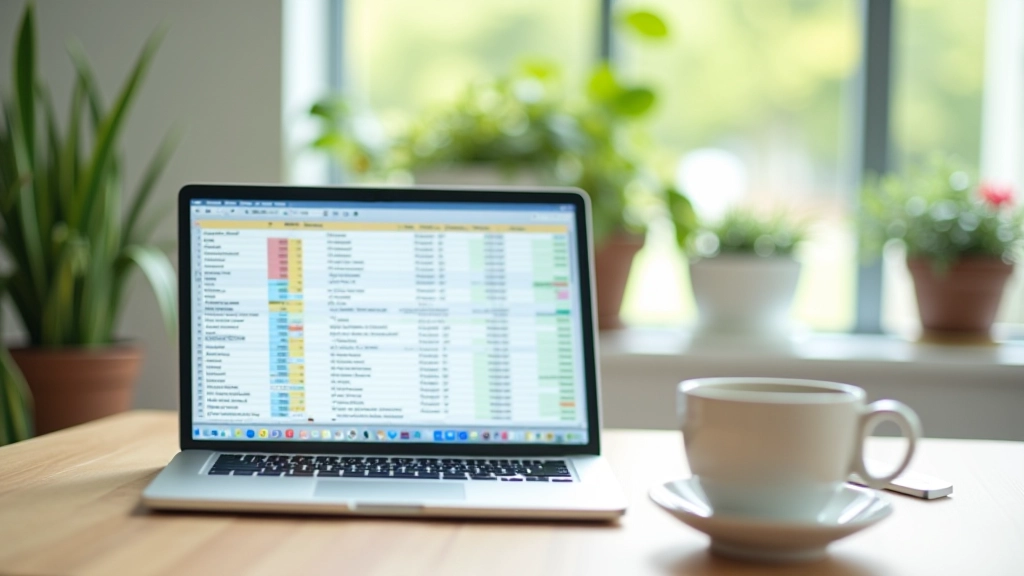
Once you've got two to three months of data, patterns start showing up. This is where it gets interesting. You're not just looking at totals — you're looking at how spending changes week to week, what categories spike, what stays consistent.
Three patterns to watch for:
- Recurring fixed costs: Rent, subscriptions, insurance. These don't change month to month. They're your baseline.
- Predictable variable spending: Groceries, gas, utilities. These shift based on season or usage but follow a pattern you can predict.
- Discretionary spending: The category that surprises you. Coffee, snacks, spontaneous purchases. This is where patterns reveal behavior.
When you're looking at your data, use simple calculations. Monthly averages are helpful. Year-over-year comparisons show seasonal patterns. Category breakdowns as percentages of total spending show what's actually important in your budget. If you're using a spreadsheet, you can build these calculations once and they update automatically.
Tools That Make This Easier
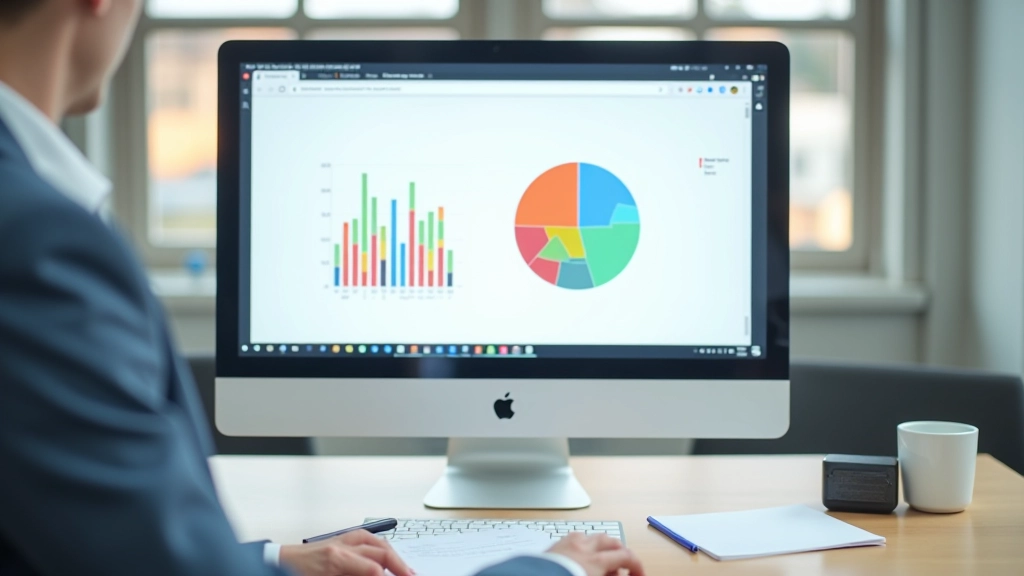
Google Sheets has SUMIF and AVERAGEIF functions that pull data based on criteria. Want to know your average spending on food? AVERAGEIF finds every "food" category entry and calculates the average. Pivot tables reorganize your data automatically — you can see spending by category, by week, by payment method.
If you're not comfortable with formulas, that's okay. Even sorting your data and manually grouping transactions by category reveals patterns. The analysis doesn't have to be sophisticated to be useful.
From Analysis to Action
This is where most people miss the point. You don't analyze spending patterns just to understand yourself better. You do it to change what's not working.
Look at your discretionary spending first. That's where change happens fastest. If you're spending $150 a month on coffee and snacks but only meant to spend $50, you've found an opportunity. Not an emergency, just a gap. You can address it by setting a daily limit, using a different payment method to track it better, or adjusting your budget based on reality instead of intention.

Then look at your fixed costs. These don't change day to day, but you can negotiate them. That $120 a month phone plan? Call and ask about lower tiers. Streaming subscriptions you're not using? Cancel them. Insurance or utilities? Shop around annually. Even small changes to fixed costs add up fast because they compound every single month.
The last step is building a realistic budget based on what you've learned. Don't create a budget based on what you wish you'd spend. Base it on what your patterns actually show. If you've spent an average of $80 monthly on personal care, don't budget $40. Budget $80 or $85. Leave room for reality. You can always adjust down if you naturally spend less, but a budget that's too tight just becomes depressing.
Monitoring Changes Over Time
Analysis isn't a one-time thing. Spending patterns shift with your life. A new semester might change your commute costs. A new job changes your schedule and eating habits. Seasonal changes affect utilities and activities.
Set a rhythm for reviewing your patterns. Monthly is common — check your spending for the past month against your budget and previous months. Quarterly gives you a longer view and shows seasonal trends. Annually, look at year-over-year changes. You'll spot patterns you'd miss in shorter timeframes.
Keep a simple log of major changes: "Started meal prep," "Got a parking pass," "Cut gym membership." This context helps you understand why your patterns shifted. Without it, you might see a drop in spending and have no idea if it's sustainable or temporary.
This article is educational only and is not financial or investment advice. Outcomes are not guaranteed and may vary. The techniques and approaches described are suggestions based on common budgeting practices. Consider consulting with a financial advisor for personalized guidance on your specific situation.
Start Your Analysis Today
Analyzing your spending patterns doesn't require expensive tools or complex systems. It requires honesty about where your money goes and curiosity about why. You already know you spend money on stuff. This process helps you understand what stuff matters to you and what doesn't.
Pick a tracking method — spreadsheet, app, or hybrid. Give it three months of data. Then sit down with that data and actually look at it. Ask yourself questions: What surprised me? What stayed the same? Where did I spend less than expected? Where did I spend more? Once you have answers, you can make real decisions about your money instead of just hoping things work out.
That's the real power of analyzing spending patterns. It's not about perfection. It's about understanding yourself well enough to make choices that match your actual values, not your imagined budget.